
Shining Light on the Brain: A Brief Look at the Past, Present, and Future of fNIRS
- Androu Abdalmalak

- Feb 19
- 10 min read
Fiat lux (let there be light) – Genesis 1:3
These few words that, in the early 1990s, took on new meaning for neuroscience when researchers demonstrated that near-infrared light could be used to probe human brain function. That insight sparked what is now known as functional near-infrared spectroscopy (fNIRS): a non-invasive, portable neuroimaging technique that has exploded in popularity and grown from a handful of proof-of-concept experiments into a globally used research tool. In fact, in recent years, fNIRS has moved out of the lab and into more clinically relevant research, where, for example, it’s helping to reshape how clinicians understand brain function in comatose patients. Pioneering work from Dr. Adrian Owen’s group has revealed something remarkable: a small subset of patients who appear entirely unresponsive can still generate task-specific brain activity, revealing hidden islands of awareness [1,2]. These findings, with the power of fNIRS, don’t just challenge long-held assumptions about comatose patients, they open the door to a future in which consciousness can be detected, and perhaps one day, communicated with, at the bedside.
In this post, we explore how fNIRS works, how the field evolved, what it can (and cannot) measure, and where it is headed next. We were fortunate to speak with Dr. David Boas, Professor at Boston University and Director of the Neurophotonics Center, and Dr. Maria Angela Franceschi, Professor of Radiology at Harvard University, two scientists who have shaped the trajectory of fNIRS over the last two decades. Their reflections offer a firsthand view of how foundational ideas became today’s standard practices.
SO, WHAT IS fNIRS AND HOW DOES IT ACTUALLY WORK?
Before diving into fNIRS, it helps to step back and briefly discuss the broader field of near-infrared spectroscopy (NIRS). NIRS refers to the use of near-infrared light to probe the chemical composition of materials. Its applications span agriculture, earth science, chemistry, and biomedical research [3]. Functional NIRS is a specialized branch focused on extracting functional information from biological tissue. While the technique is widely used to study muscle oxygenation and breast tissue, fNIRS has become almost synonymous with non-invasive studies of the human brain [4,5].


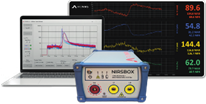
Figure 1: Figure illustrating some NIRS systems that are commercially available. Figure (A) was retrieved from [6], and from left to right it illustrates the LABNIRS system from Shimadzu, the Brite system from Artinis, and the LUMO system from Gowerlabs, respectively. Figure 1B was retrieved from nirx.net highlighting the NIRSport 2. Figure 1C demonstrates the commercially available Kernel Flow system retrieved from kernel.com, and finally Figure 1D was retrieved from pionirs.com showcasing the NIRSBOX system.
At its core, an fNIRS system is elegantly simple. Consisting of at least:
One light source (typically an LED or laser diode)
One light detector (commonly silicon photodiodes or avalanche photodiodes) placed several centimeters apart on the scalp.
Light emitted from the source diffusively scatters through the scalp, skull, and cortical tissue. A small fraction of these photons eventually reach the detector. By tracking how light intensity changes over time, we can infer underlying brain activity.
Much like functional magnetic resonance imaging (fMRI), fNIRS measures the blood-oxygen-level-dependent (BOLD) response [5]. Increased neural activity leads to elevated metabolic demand, triggering localized increases in blood flow and volume. This results in an increase in oxygenated hemoglobin (HbO) and a corresponding decrease in deoxygenated hemoglobin (HbR), both of which absorb near-infrared light differently. In the wavelength range of ~ 600-900 nm, often referred to as the optical window, near-infrared light can penetrate deeper into tissue due to the decreased scattering of photons, the lower absorption by water, and the unique absorption characteristics of hemoglobin [5].

Figure 2: Absorption spectra for various chromophores (i.e., light absorbers) in tissue (retrieved from [5])
EARLY RESEARCH THAT SHAPED THE FIELD
When we asked Dr. Boas about early experiments that influenced how fNIRS systems are designed today, he shared a story that highlights the importance of careful measurements and how earlier studies drove progress:
“One story I like to tell is how the fNIRS studies during the first decade (1993-2003) mostly used 780nm with 830nm with the idea that it was important to have the two wavelengths on either side of the isosbestic point in order to minimize differences in the wavelength dependent scattering coefficient to ensure that both wavelengths sampled the same volume of tissue. However, it was shown by a few papers around [the year] 2000 that having the two wavelengths too close together resulted in strong cross-talk between HbO and HbR with the result that the smaller HbR decrease was often obscured by cross-talk from the larger HbO change. Those papers showed it was better to use a wavelength <765nm with one >830nm in order to minimize this strong cross-talk. As a result, the majority of fNIRS systems now use wavelengths <=760 with >=830.”
This realization directly shaped the wavelength choices used in most commercial and research fNIRS systems today.
Additionally, Dr. Boas highlighted four seminal studies that appeared in 1993 [7-10], that followed the BOLD fMRI demonstration of human brain activation measurements, by measuring activation induced changes in deoxy-hemoglobin. It was then straight-forward to connect that NIRS could measure the same hemoglobin concentration changes induced by brain activation. These first four papers used no more than a few channels. “If I recall correctly, the first imaging fNIRS paper was 1995 from Hitachi. While optical breast imaging was happening at a similar time, I believe these developments were independent. Later in in the 1990’s, around 2000, diffuse optical tomography ideas from optical breast imaging started spilling over into fNIRS imaging, but the first fNIRS imaging had already been done.”
WHAT fNIRS CAN (AND CANNOT) MEASURE
Like all imaging modalities, fNIRS is governed by physical constraints. As light travels through biological tissue, its intensity decays exponentially with increasing source-detector distance (SDD). In adults, typical SDDs range from 3–4 cm, corresponding to a penetration depth of roughly half that distance. As a result, fNIRS is sensitive to superficial cortical regions, rather than deep brain structures.


Figure 3A: “Banana” profile of light propagation in tissue. The distance between the source and detector dictate the depth penetration, where short separation channels primarily interrogate the superficial layers (in adults) and capture physiological noise, while longer channels reach the brain and capture hemodynamic changes reflective of brain activity. This figure was retrieved from [11]. Figure 3B illustrates the sensitivity profile (i.e., the sensitivity of a given probe layout to the brain) of a near-full head montage. The image was retrieved from [12].
Additionally, because photons sample tissue between the source and detector, fNIRS inherently has centimeter-scale spatial resolution (although this can be improved by high-density systems). With prior knowledge of where activity is expected, even a single source-detector pair can be informative. In practice, however, most modern studies use a few sources and detectors, with some systems offering full-head or high-density coverage [13,14].
Another important limitation arises from the widespread use of continuous-wave (CW) systems. Because CW systems do not encode timing or phase information, the exact photon path length cannot be directly measured. This means most commercially fNIRS systems can only detect changes in HbO and HbR, but not their absolute concentrations. More advanced approaches, such as frequency-domain or time-resolved NIRS, can estimate absolute values, but at the cost of increased system complexity and expense.
Despite these constraints, misconceptions persist. As Dr. Boas noted:
“Many are still surprised we can measure the brain activation through the scalp and skull, that light actually reaches there and back. Scalp is a confounding influence as many of us know, but it is still possible to measure human brain activation despite the greater sensitivity to the scalp than the brain. Also, many understand that we don’t measure deep brain regions but then dismiss fNIRS as a result. Yet, fNIRS measures the crowns of gyri very well and this represents a large fraction of the cortex and remains very valuable for many many studies as indicated by the growing number of high profile fNIRS application papers.”
These misconceptions were initially addressed by Villringer and colleagues and Hoshi et al., in the early 1990’s. In their earlier work, Villringer et al., elegantly demonstrated a control measure of scalp changes to show that they were not in fact measuring scalp “activation” [7]. On the other hand, Hoshi et al., measured a control brain region versus the target brain region to show that the activation was localized, highlighting the spatial specificity of fNIRS [9].
WHAT MAKES UP AN fNIRS SIGNAL?
An fNIRS signal is not a pure reflection of neural activity. Because it measures hemodynamic changes, it also captures several physiological signals including:
Cardiac pulsation (~1–1.5 Hz in adults)
Respiration (~0.2–0.3 Hz)
Mayer waves, slow oscillations related to blood pressure (~0.05–0.1 Hz)
These signals can often exceed the amplitude of the brain hemodynamic responses. Extracting meaningful neural information therefore requires thoughtful experimental design, appropriate hardware choices, and robust preprocessing strategies [15, 16].

Figure 4: Various oscillations that make up the fNIRS signal ((VLF—Very Low Frequency < 0.01 Hz; LF—Low Frequency 0.01–0.2 Hz; Respiration 0.2–0.6 Hz; and Cardiac 0.6–2.5 Hz). Figure retrieved from [17].
FROM EARLY EXPERIMENTS TO REAL-WORLD APPLICATIONS
fNIRS has experienced remarkable growth over the last two decades [18]. Earlier studies focused on proof-of-concept tests such as detecting simple task-evoked brain activity (such as finger tapping) using only a few channels. Additionally, replicating common fMRI studies and validating fNIRS against more established modalities was also common.
Later on, fNIRS research focused on infant populations - where MRI is challenging, and on basic cognitive neuroscience, including language processing, motor control, and social cognition [18]. Its tolerance for motion artifacts made it uniquely suited for these studies. Throughout the rest of this year, we will be highlighting some of these applications in more detail.

Figure 5: Figure highlighting the increase in fNIRS publications from 2011-2021 (retrieved from [19])
More recently, fNIRS has begun to move beyond the lab. In Japan, it is used clinically as a supplemental tool in the assessment of depression and other psychiatric conditions, marking the first large-scale clinical adoption of the technology.
Looking ahead, Dr. Boas highlighted two particularly promising directions: neurofeedback and neurorehabilitation. He expects both areas to expand rapidly over the next decade, not only in research environments but also in real-world settings. For a recent comprehensive review on the applications of fNIRS in neurofeedback, please see the recent work by Klein et al., 2024 [20].
He also expects more and more high density fNIRS devices to be used that are wearable during everyday activities. “I expect that we will see devices that are as easy to wear as a hat. The applications will continue to explode!”
Lastly, an emerging application of fNIRS, as discussed earlier, is in clinical research. In a recent patient-driven case study, McAuley et al. demonstrated that even resting-state fNIRS (i.e., measuring brain activity while a patient simply sits quietly, with no tasks or stimuli), can reveal something potentially practical: the impact of deep brain stimulation (DBS) settings [21]. By tracking how strongly the prefrontal and motor regions are connected with one another, the researchers found an expected pattern. DBS settings associated with impaired gait, produced elevated connectivity, whereas the setting that best supported gait was marked by lower connectivity, suggesting increased gait automaticity and lower executive demands. This proof-of-concept study highlights the potential of fNIRS as a noninvasive, bedside tool for personalizing neuromodulation therapies and perhaps one day can open the door to guiding clinical decision-making in real time.
FINAL THOUGHTS
From early wavelength debates to modern clinical applications, fNIRS has evolved through a steady interplay of physics, physiology, and curiosity. As systems become more sophisticated, and applications more ambitious, the ability to study brain function with light continues to open new windows into the human mind.
At the same time, the field continues to grapple with familiar challenges, including separating neural signals from physiology, improving depth sensitivity, and establishing shared standards for analysis and interpretation. Addressing these challenges is not a sign of immaturity, but of a field actively refining its tools as it moves towards robust and reproducible science.
Looking ahead, the next chapter of fNIRS will likely be shaped less by hardware alone and more by how thoughtfully we analyze and interpret data. As analysis methods mature and multimodal approaches become the norm, fNIRS stands to play an increasingly central role in understanding the brain not just in isolation, but as it operates in the complexity of everyday life.
References
Kazazian, K. et al. Detecting awareness in the intensive care unit using functional near-infrared spectroscopy. Ann. Neurol. 98, 1201–1209 (2025).
Kazazian, K. et al. Functional near-infrared spectroscopy: a novel tool for detecting consciousness after acute severe brain injury. Proc. Natl Acad. Sci. USA 121, e2402723121 (2024).
Tsuchikawa, S., Ma, T. & Inagaki, T. Application of near-infrared spectroscopy to agriculture and forestry. Anal. Sci. 38, 635–642 (2022).
Barstow, T. J. Understanding near infrared spectroscopy and its application to skeletal muscle research. J. Appl. Physiol. 126, 1360–1376 (2019).
Scholkmann, F. et al. A review on continuous wave functional near-infrared spectroscopy and imaging instrumentation and methodology. NeuroImage 85, 6–27 (2014).
Quaresima, V. & Ferrari, M. A mini-review on functional near-infrared spectroscopy (fNIRS): where do we stand, and where should we go? Photonics 6, 87 (2019).
Villringer, A. et al. Near infrared spectroscopy (NIRS): a new tool to study hemodynamic changes during activation of brain function in human adults. Neurosci. Lett. 154, 101–104 (1993).
Chance, B. et al. Cognition-activated low-frequency modulation of light absorption in the human brain. Proc. Natl Acad. Sci. USA 90, 3770–3774 (1993).
Hoshi, Y. & Tamura, M. Detection of dynamic changes in cerebral oxygenation coupled to neuronal function during mental work in man. Neurosci. Lett. 150, 5–8 (1993).
Kato, T. et al. Human visual cortical function during photic stimulation monitoring by means of near-infrared spectroscopy. J. Cereb. Blood Flow Metab. 13, 516–520 (1993).
Rupawala, M. et al. Shining a light on awareness: a review of functional near-infrared spectroscopy for prolonged disorders of consciousness. Front. Neurol. 9, 350 (2018).
Abdalmalak, A. et al. Effects of systemic physiology on mapping resting-state networks using functional near-infrared spectroscopy. Front. Neurosci. 16, 803297 (2022).
Eggebrecht, A. T. et al. Mapping distributed brain function and networks with diffuse optical tomography. Nat. Photonics 8, 448–454 (2014).
Anderson, J. E. et al. High-density multidistance fNIRS enhances detection of brain activity during a word-color Stroop task. Neurophotonics 12, 035010 (2025).
Yücel, M. A. et al. Best practices for fNIRS publications. Neurophotonics 8, 012101 (2021).
Tachtsidis, I. & Scholkmann, F. False positives and false negatives in functional near-infrared spectroscopy: issues, challenges, and the way forward. Neurophotonics 3, 031405 (2016).
Hocke, L. M. et al. Automated processing of fNIRS data—A visual guide to the pitfalls and consequences. Algorithms 11, 67 (2018).
Boas, D. A. et al. Twenty years of functional near-infrared spectroscopy: introduction for the special issue. NeuroImage 85, 1–5 (2014).
Kinder, K. T. et al. Systematic review of fNIRS studies reveals inconsistent chromophore data reporting practices. Neurophotonics 9, 040601 (2022).
Klein, F. et al. From lab to life: challenges and perspectives of fNIRS for haemodynamic-based neurofeedback in real-world environments. Philos. Trans. R. Soc. B 379, 20230087 (2024).
McAuley, M. D. et al. Parkinson’s disease participant-led research: towards neuroimaging-assisted deep brain stimulation programming. J. Parkinsons Dis. 15, 1535–1539 (2025).
Comments